Compare Data
This task will read a series of csv data files and scan them for relationships between one another.
](CompareData_Screen1.png)
OPTIONS
| OPTION | DESCRIPTION |
|---|---|
| CSV Files | The files containing the schema and data for the tables we wish to compare. |
INPUT
CONFIGURATION
Paths to 2 or more CSV files must be provided.
DATA
No special requirements.
OUTPUT
A table containing the following columns will be produced.
| COLUMN | DESCRIPTION |
|---|---|
| DATASOURCE1 | The name of the first datasource or table to be compared. |
| DATASOURCE2 | The name of the second datasource or table to be compared. |
| COLUMN1 | The name of the column within DATASOURCE1 which is being compared. |
| COLUMN2 | The name of the column within DATASOURCE2 which is being compared. |
| UNIQUE_MATCHES | The number of unique matches between DATASOURCE1 COLUMN1 and DATASOURCE2 COLUMN2. |
| MATCH_PERCENT | The percentage of matches between DATASOURCE1 COLUMN1 and DATASOURCE2 COLUMN2. |
| UNIQUE_TRIMMED_MATCHES | Prior to the comparison, Dex will trim both columns being compared. This is the number of unique matches between DATASOURCE1 COLUMN1 and DATASOURCE2 COLUMN2 after having performed that transformation. |
| TRIMMED_MATCH_PERCENT | The percentage of matches between DATASOURCE1 COLUMN1 and DATASOURCE2 COLUMN2 after having first trimmed both columns. |
EXAMPLES
EXAMPLE 1
Given the schema described below, this example illustrates how we use this task to derive visual insight.
SCHEMA
CUSTOMERS
| ID | NAME | AGE | GENDER |
|---|---|---|---|
| 1 | FRAN | 32 | FEMALE |
| 2 | JAN | 22 | FEMALE |
| 3 | STAN | 31 | MALE |
| 4 | DAN | 28 | MALE |
ORDERS
| ITEM | CUSTOMER | ITEM | QUANTITY |
|---|---|---|---|
| 1 | 3 | 2 | 4 |
| 2 | 2 | 1 | 1 |
| 3 | 1 | 2 | 2 |
| 4 | 4 | 3 | 1 |
| 5 | 1 | 4 | 2 |
| 6 | 3 | 3 | 2 |
| 7 | 2 | 4 | 1 |
INVENTORY
| ITEM | NAME | PRICE |
|---|---|---|
| 1 | HAMMER | 8.21 |
| 2 | SCREWDRIVER | 6.54 |
| 3 | WRENCH | 12.45 |
| 4 | DRILL | 39.95 |
| 5 | SANDPAPER | 2.46 |
VISUALIZATION
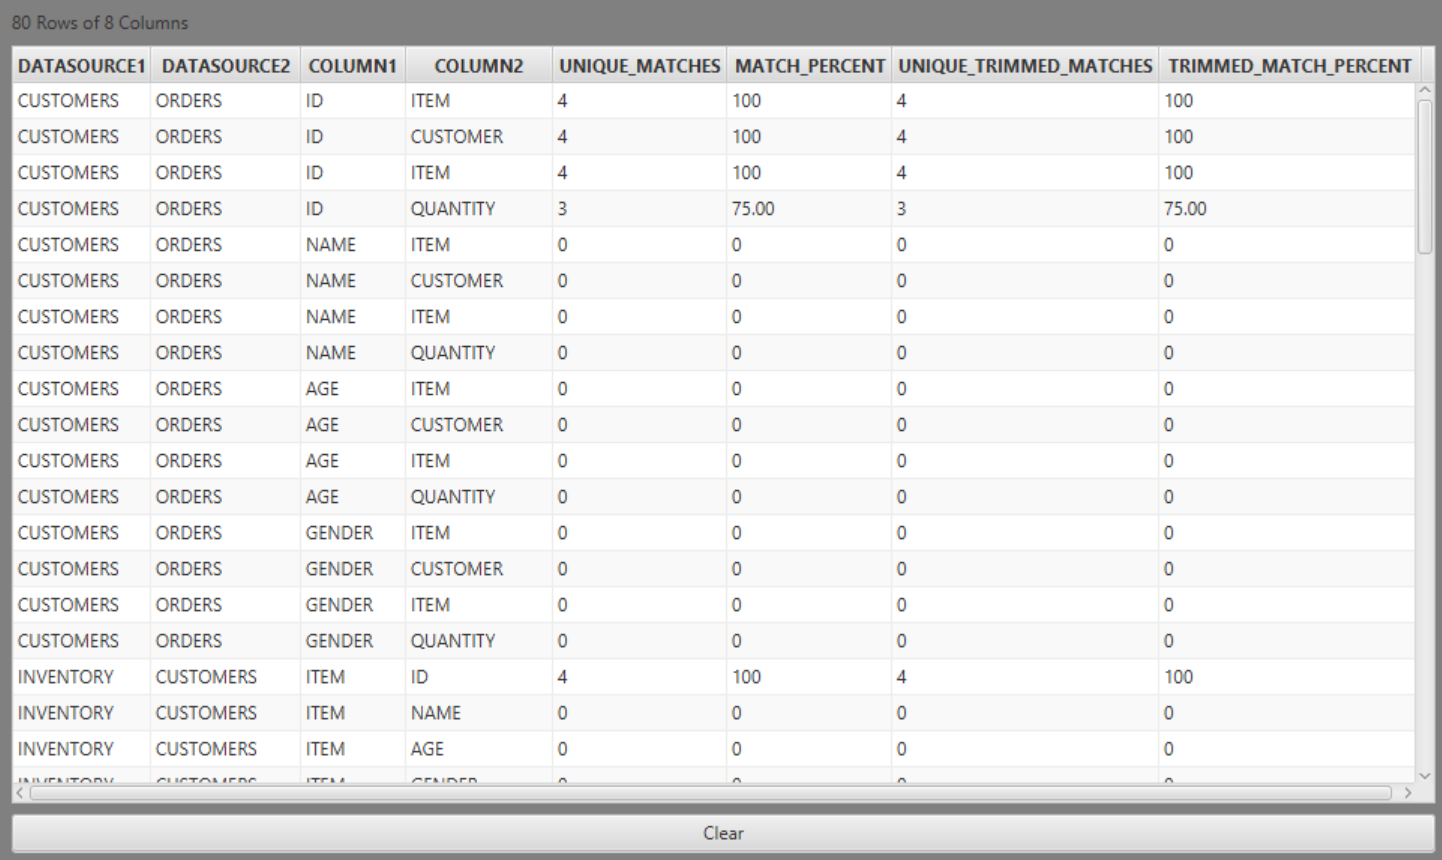
The raw output from Compare Data looks like:
A visualization of running Compare Data on these tables expressed in a Parallel Coordinates chart looks like:
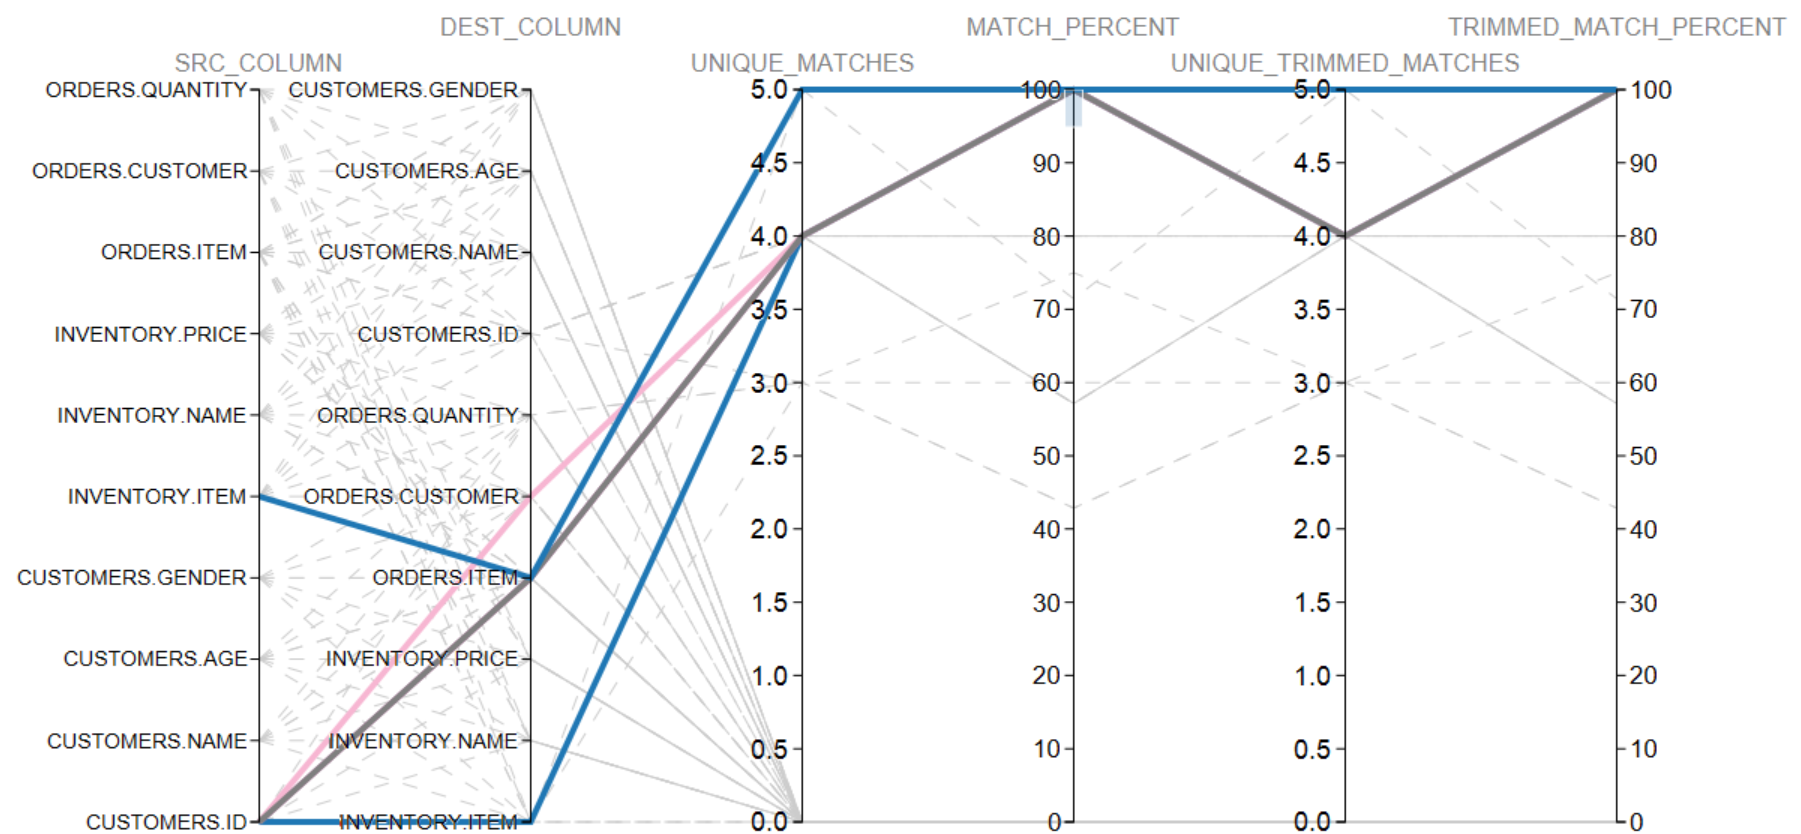
Commentary
In this visualization we have highlighted all relationships which have a 100% coorelation. We see the following:
| RELATIONSHIP | COMMENT |
|---|---|
| INVENTORY.ITEM and CUSTOMER.ID | While there is a 100% coorelation between these two columns, it is purely accidental as the sequences happen to align. The lesson here is that sometimes coincidental relationships form naturally within a dataset. Do not trust the comparison data blindly. |
| INVENTORY.ITEM and ORDERS.ITEM | This appears to be a legitimate relationship. |
| CUSTOMER.ID and ORDERS.CUSTOMER | This appears to be a legitmate relationship. |
| CUSTOMER.ID and ORDERS.ITEM | Coincidental relationship. |
| CUSTOMER.ID and INVENTORY.ITEM | Coincidental relationship. |