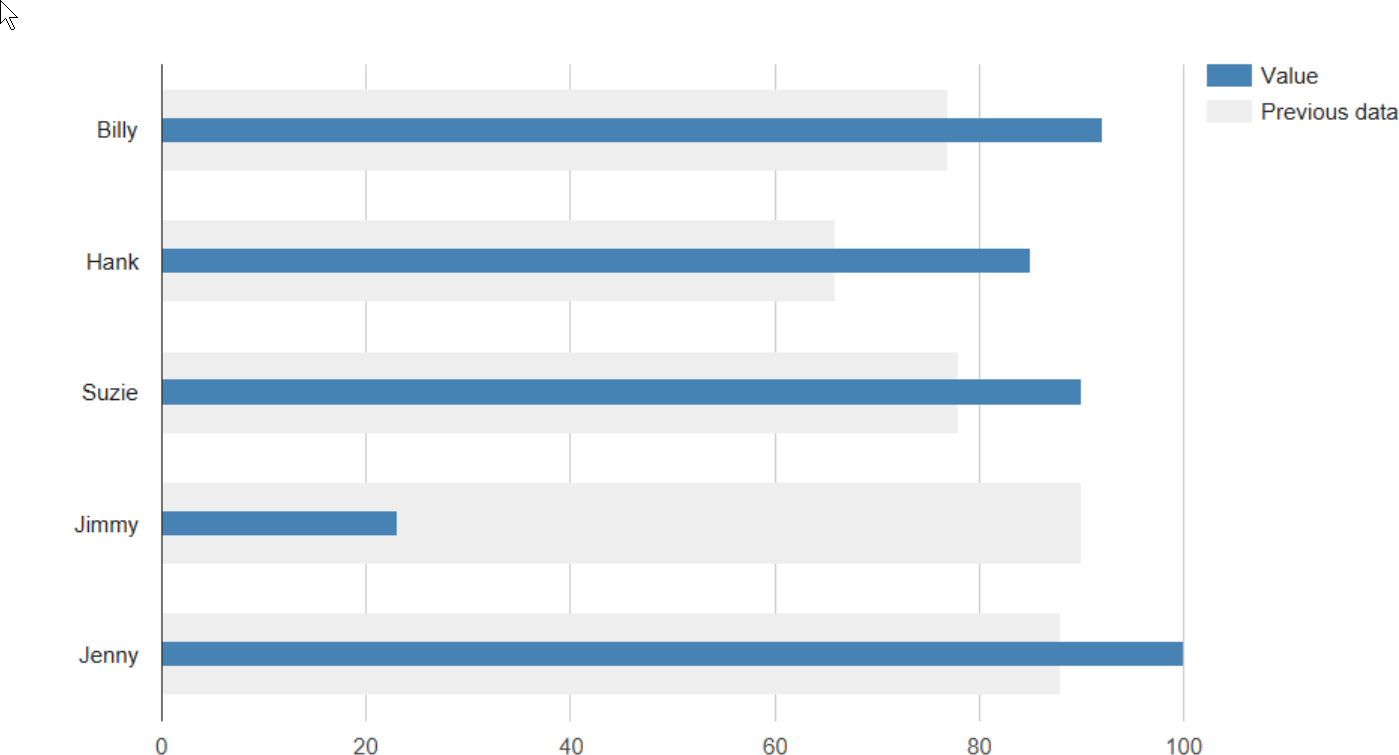
Diff Bar Chart
This task, when supplied the appropriate data, will display a difference bar chart using Google Charts.

| OPTION | DESCRIPTION |
|---|---|
| NONE | NONE |
INPUT
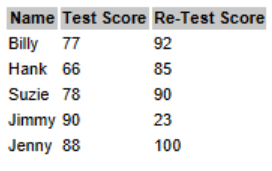
This component is picky about it's input. Here is the data for the above example:

This task requires that:
| NAME | LOCATION | TYPE | DESCRIPTION |
|---|---|---|---|
| CAT | 1 | Unique/Categorical | This field represents the category of something we wish to compare before and after measurements for. |
| BEFORE | 2 | Numeric | This column contains numeric data representing the previous state of something. |
| AFTER | 3 | Numeric | This column contains numeric data representing the current state of something. |
OUTPUT
A difference chart is generated which compares BEFORE to AFTER across each CAT.