Bar Chart
This task will display an JavaFX bar chart.
| OPTION | DESCRIPTION |
|---|---|
| X Selector | Selects the X axis. |
| Y Axis Selector | Selects one or more columns to graph in series. |
| X Title | Sets an optional title for the X axis. |
| Y Title | Sets an optional title for the Y axis. |
| Chart Title | Sets an optional chart title. |
| Title Side | Sets the location of the chart title. |
| Legend Side | Sets the side on which to draw the legend. |
| Lower Bound | Allows the user to manually crop the data to a specified lower bound. |
| Upper Bound | Allows the user to manually crop the data to a specified upper bound. |
| Tick Unit | The |
| Accumulate | When set to true, will treat redundant x values by adding the y values to an overall series tally. When false, it does not. |
INPUT
The X column can be categorical or numeric data. The Y column(s) must all contain numeric data.
OUTPUT
A JavaFX bar chart to specification.
EXAMPLES
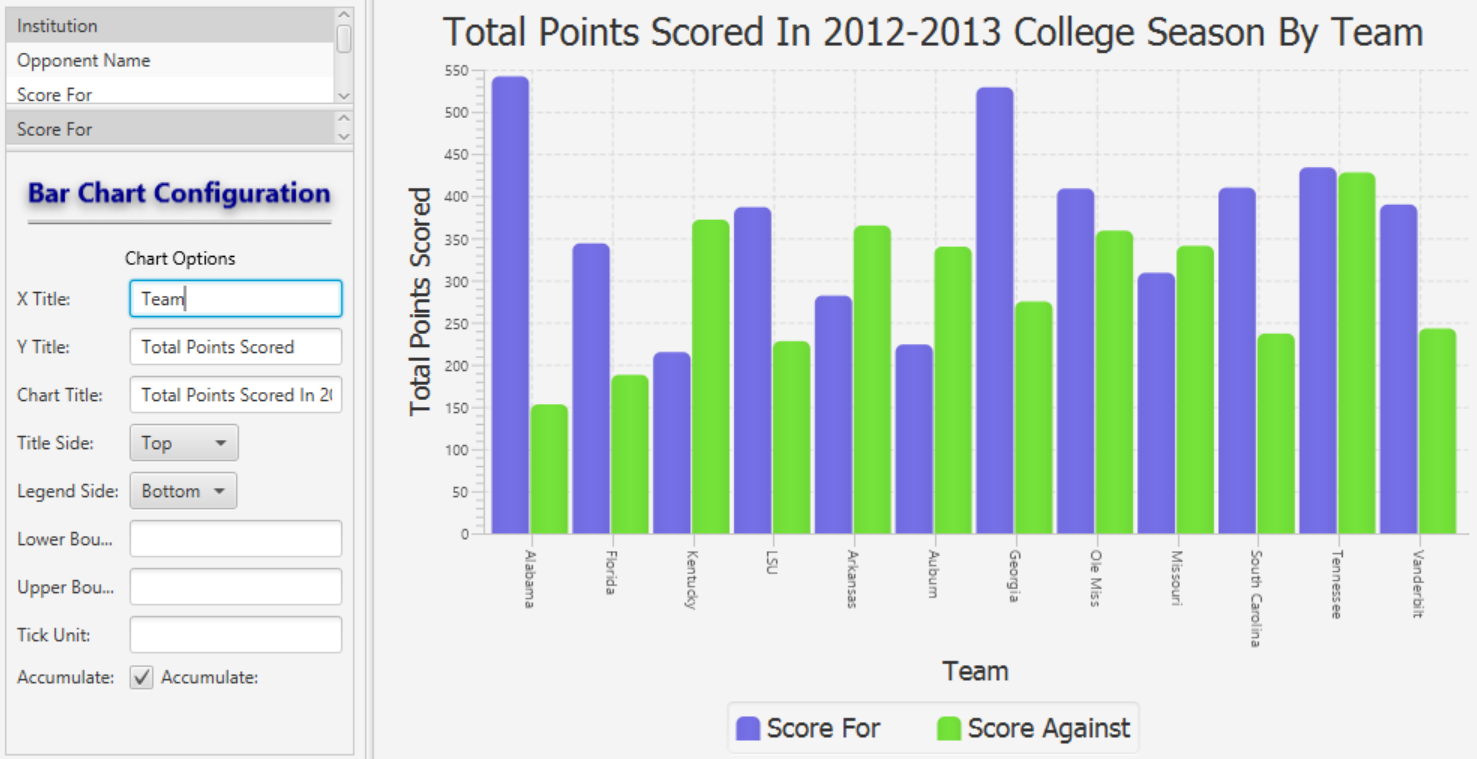
Charting Football Performance
In this bar chart we graph the total points scored by and scored on selected College football teams from the 2012-2013 football season.
Notice that "Accumulate" is set. This causes each Y value associated with the X column (Institution in this case), to be totaled.