K Finder
This task will assist the user in finding the optimal value for k where k represents the number of clusters occurring within the selected features of the dataset.
CONFIGURATION
| OPTION | DESCRIPTION |
|---|---|
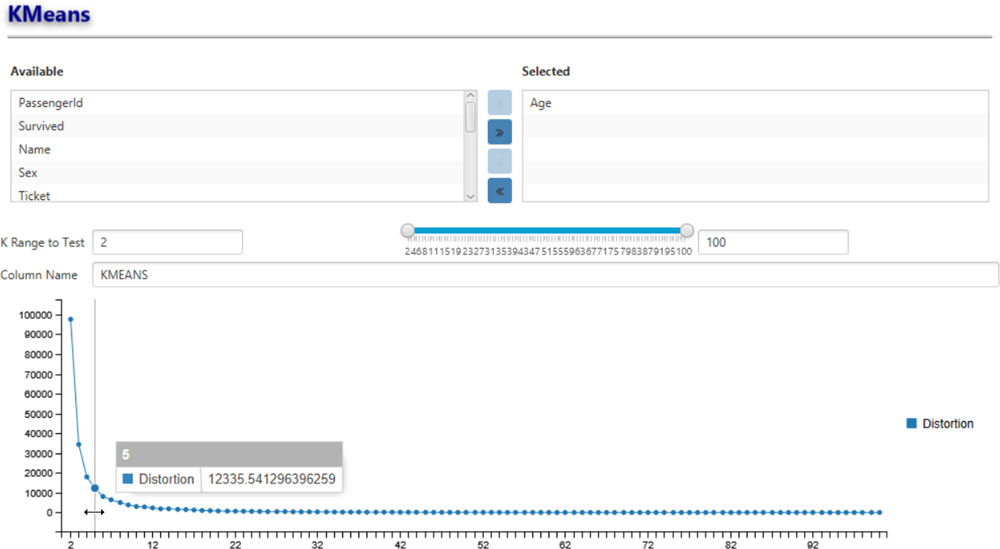
| Select Columns | Use column selector to determine which features to include in the K Finder distortion analysis. |
| K Range to Test | The range of K to test. In the previous screenshot this range is from 2 to 100 representing a distortion test for all k >= 2 and <= 100. |
INPUT
A dataset.
OUTPUT
The plot generating will plot the various values of k versus their distortion. Ideally, we locate the elbow of the plot which indicates where adding more clusters produces diminishing returns. In this plot, this appears to happen at around 5 clusters for the Age feature.