XY Chart
This task will display a JavaFX XYChart of the specified type. Line, Area, Stacked Area and Scatterplots are available.
| OPTION | DESCRIPTION |
|---|---|
| Chart Type | Line, Area, Scatter & Scatterplots are available. |
| X Column | A single numeric column to use for the x axis. |
| Y Column | One or more y columns to chart. Each selected column will become it's own series. |
| X-Axis: Upper Bound | The user may crop the graph to a manually supplied upper bound for the x axis. |
| X-Axis: Lower Bound | The user may crop the graph to a manually supplied lower bound for the x axis. |
| X-Axis: Tick Unit | Specifies how often to draw tick marks. |
| X-Axis: Title | An optional title for the x axis. |
| Autorange | When true, Java FX will automatically attempt to discover the relevant graphing range. |
| Y-Axis: Upper Bound | The user may crop the graph to a manually supplied upper bound for the y axis. |
| Y-Axis: Lower Bound | The user may crop the graph to a manually supplied lower bound for the y axis. |
| Y-Axis: Tick Unit | Specifies how often to draw tick marks. |
| Y-Axis: Title | An optional title for the y axis. |
| Chart Title | An optional title for the chart. |
| Points On/Off | When selected, will draw the points which comprise the XY chart. |
| Tooltips On/Off | When selected, will supply tooltips when the user hovers over a point. |
INPUT
At least one numeric column.
OUTPUT
A JavaFX XY chart of the selected type to the configured specification.
EXAMPLES
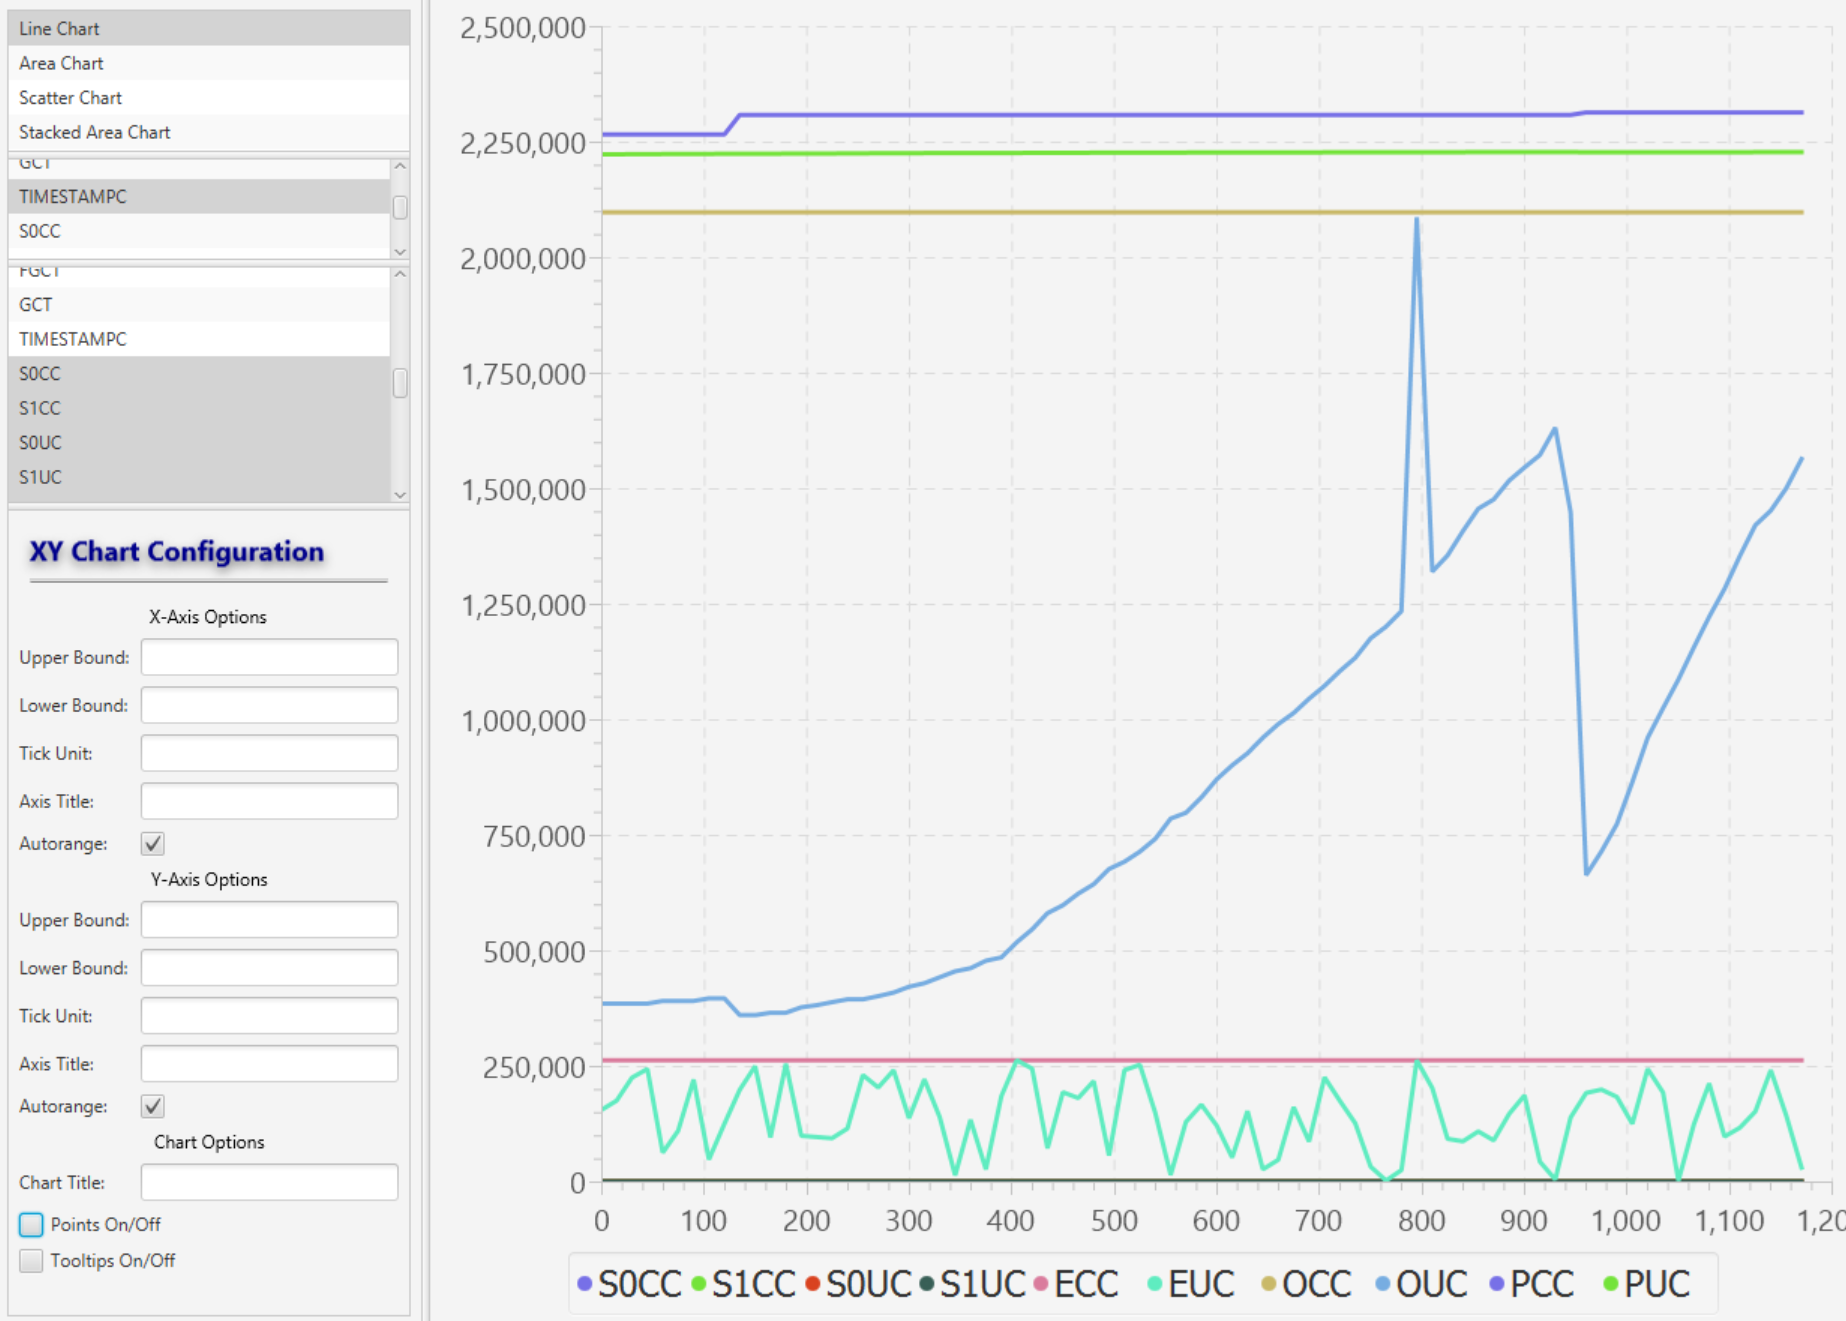
Line Chart
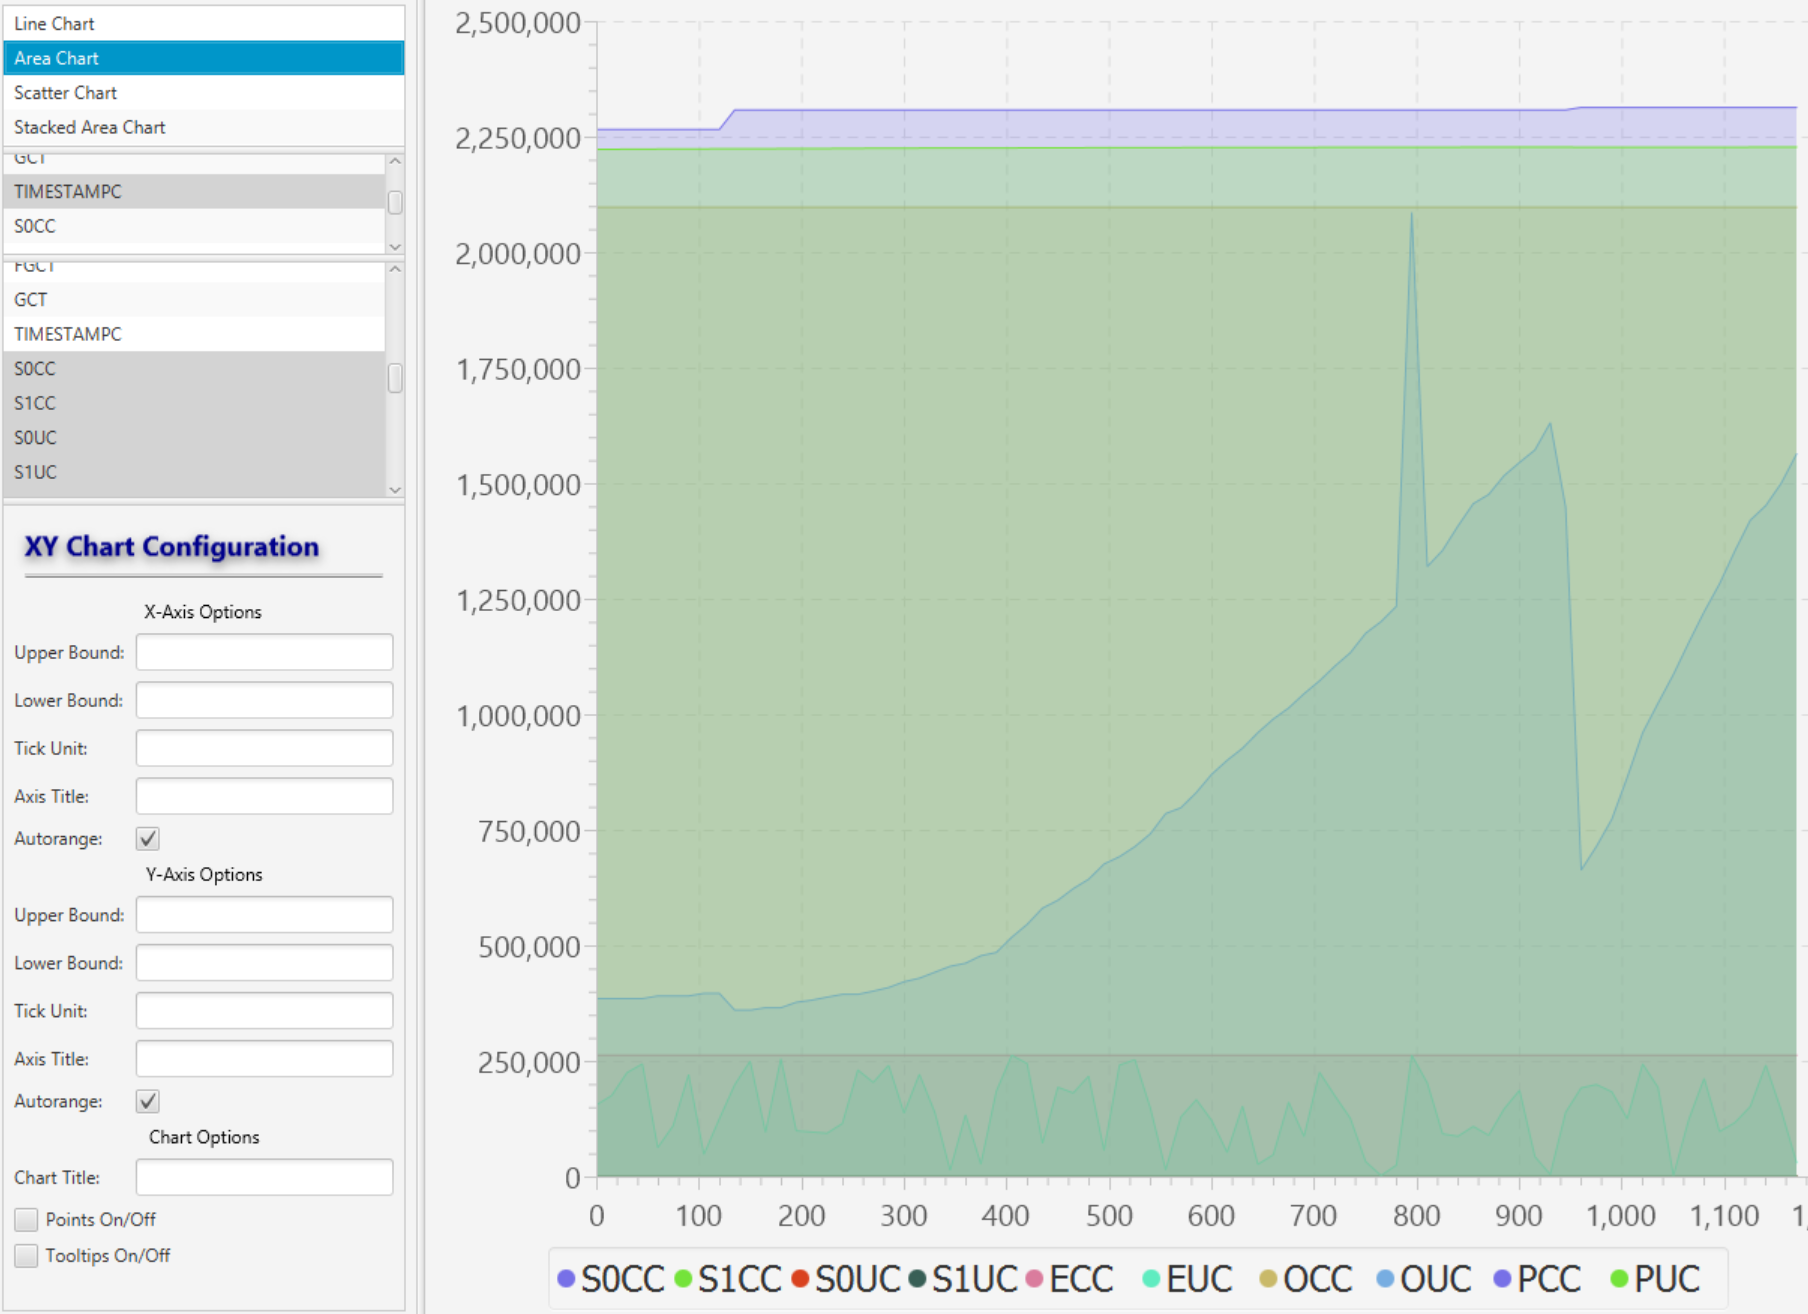
Area Chart
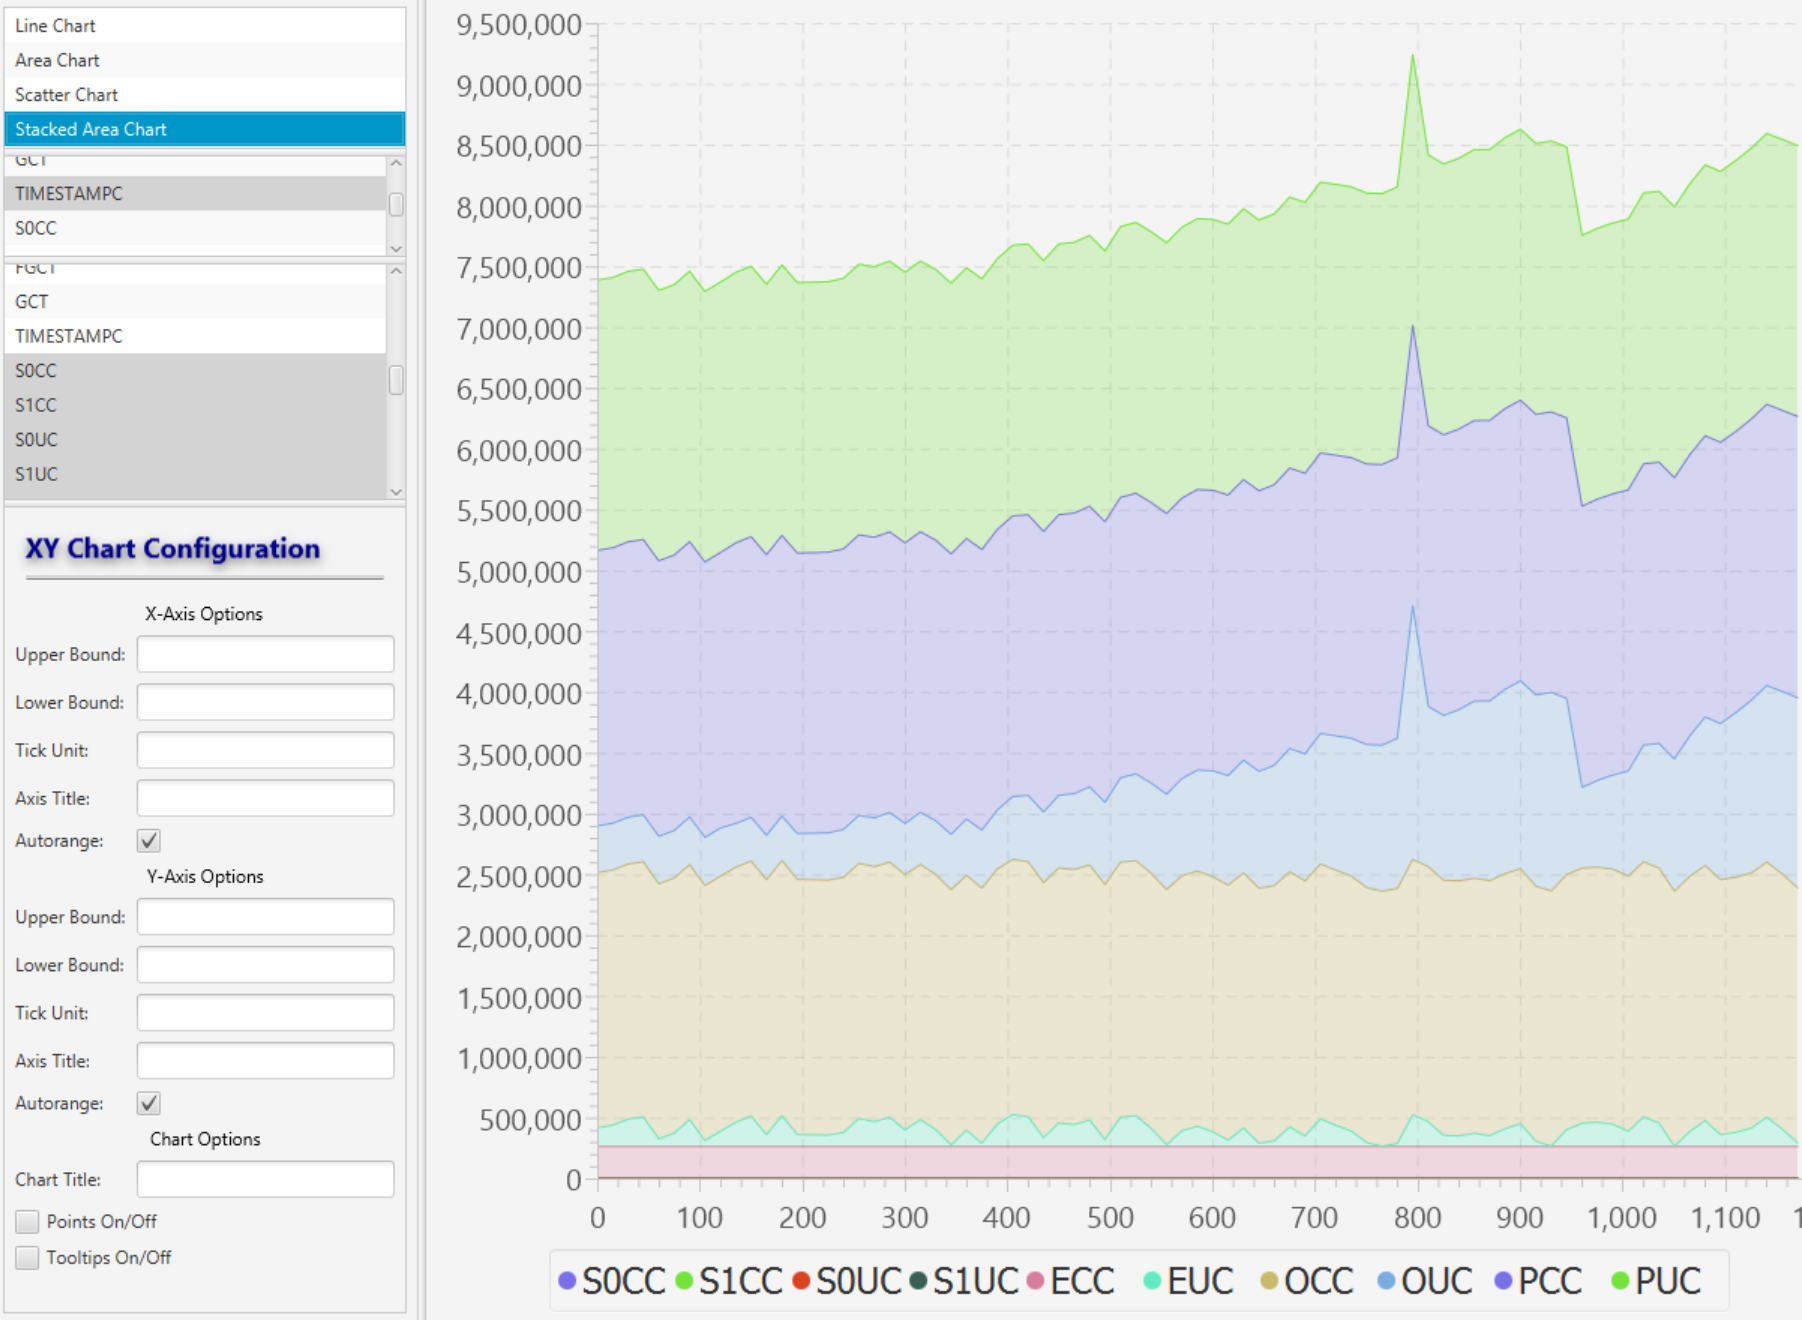
Stacked Area
Scatterplot
